Thursday, September 18, 2008

Daily chart 20 SMA failure and hanging man


Here on the daily chart price assaulted 20 SMA broke and could not hold and closed below 20 SMA. The short term trend is also down. The good strategy here is to Sell rallies or stand aside.
The 20 SMA is slanting down.Price closed below 20 SMA . MACD is in sell Mode.Target can be the Low Price touched and Strop Loss can be placed 10 pips above 20 SMA
Forexcentral

SPRINGS & UPTHRUSTS

Most of the time , the markets are not in a trending mode but rather in a lateral range.On such occations, the market is in a relative state of harmony with neither the bulls nor the bears in charge.As previously mentioned when the markets are in a state of 'WA' , they will trade in a quiet, horizontal band.At times , however, the bears or bulls may assault a prior high or low level.
Trading opportunities can arise in these occations, specifically if there is an un sustained break-out from either a support or resistance level, it can present an attractive trading opportunity.
In such a scenareo there is a strong probability there will be return to the opposite side of the congestion band.This type of false break-out is called upthrust.If the upthrust coincides with a bearish candle stick indicator it is an appealing opportunity to short.
The opposite of an upthrust is the spring.The spring develops when prices break through aprior low.Then prices spring back above the broken support area.In other words new lows could not hold.Buy if prices push back above the old lows.The objective would be for a retest of the congestion zones upperband.The stop would be under the lows made on the day of the spring.
Trading springs and upthrust is so effective because they provide a clear target(the opposite end of the trading range) and protective stop(the new high or low made with the false break out).Springs and upthrust work very well. Muraleedharan http://forexcentral.googlepages.com

Wednesday, September 17, 2008

The Line of Least Resistance

The Price always move through the line of least Resistance.The traders task is to identify and determine the speculative line of least resistance at the moment of trading and trade in the direction of least resistance.A trader should wait for this moment when the line defines itself and that is the traders signal to get in.
In other words by crossing a support or resistance the line of least resistance is established.It will not be difficult to make money if a trader always stick to his speculative guns, that is waited for the line of least resistance to define itself and began buying only when the price said up or selling only when the price said down breaking key levels of support or resistance.
The major task of the trader at this point is to find out real break-outs.Most of the time the break-outs are false and there is a high possibility of traders being caught in false break-outs loosing both material and mental capital.

Thursday, September 4, 2008

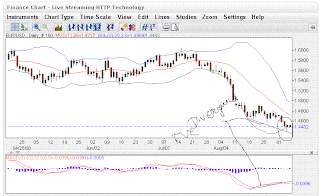
EUR/USD Daily chart Failed Hammer pattern


The hammer pattern that on 3rd September is a failed pattern.The price broke the hammer HP of 1.4523 and touched 1.4544. But could not sustain the break out and fell below the break out point signalling a false break out.The price retraced and broke below the LP of hammer1.4384. Ten pips below is a good place to short the market. The daily chart is given for illustration.This another example of MACD positive divergence which did not get a trigger signal by a real break out from hammer HPLevel.Some time pattern failure give better set ups and opportunity for entry point.Lowest Price reached after the break down is 1.4222 and closed below the break down level indicating dollar stength and EUR weakness.The days sentiment is buying of USD and selling of EUR. Strategy is to short EUR/USD pair on rallies or stand aside.Muraleedharan

Wednesday, September 3, 2008

EUR USD Hammer pattern on BB Low Band


A hammer pattern is formed on the EURUSD daily chart and the chart is shown below for readers of this blog.MACD 5/32/5 is shown on the chart .The price is going down and the MACD is rising up ,an instance of positive divergence.After a series of down days a hammer is formed inside the circle.You may also notice the price is closed inside the Lower Band.The set-up is the following 1) MACD is showing a positive divergence in the oversold zone.2)There a series of down days to reverse. 3)A hammer pattern is formed on the Bollinger band ,Lower band and closed inside the lower band. This is a set-up which signals the short term reversal of the price.The USD is going to be weak against EUR in the short term.Hence the theme in the comming sessions will be USD selling and EUR buying as per the set-up.
Entry trigger and confirmation is, if the price breaks above 1.4523 , that confirms the USD weakness against the EUR and a long position can be initiated with a stop loss 10 pips below the Low Price of the hammer and targer 10 pips below the UB of the Bollinger band.
The Risk for the day is the news items, USD mortgauge deliquencis, EUR Europen Central bank rate decision.Both events can cause high volatility in the market. Muraleedharan