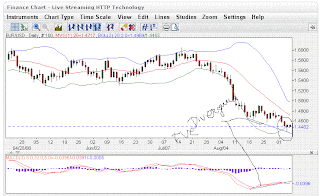
A hammer pattern is formed on the EURUSD daily chart and the chart is shown below for readers of this blog.MACD 5/32/5 is shown on the chart .The price is going down and the MACD is rising up ,an instance of positive divergence.After a series of down days a hammer is formed inside the circle.You may also notice the price is closed inside the Lower Band.The set-up is the following 1) MACD is showing a positive divergence in the oversold zone.2)There a series of down days to reverse. 3)A hammer pattern is formed on the Bollinger band ,Lower band and closed inside the lower band. This is a set-up which signals the short term reversal of the price.The USD is going to be weak against EUR in the short term.Hence the theme in the comming sessions will be USD selling and EUR buying as per the set-up.
Entry trigger and confirmation is, if the price breaks above 1.4523 , that confirms the USD weakness against the EUR and a long position can be initiated with a stop loss 10 pips below the Low Price of the hammer and targer 10 pips below the UB of the Bollinger band.
The Risk for the day is the news items, USD mortgauge deliquencis, EUR Europen Central bank rate decision.Both events can cause high volatility in the market. Muraleedharan